Debug Sass & Less in Webkit Inspector And Save CSS Changes

Sass and Less are two flavors of stylesheet language extensions that offer syntactic awesomeness which should’ve been built into plain CSS in the first place. Stuff like variables, mixins and whatnot.
We’re going to be having a lot of fun debugging them properly in webkit inspector, with proper line numbers and file names. And on top of that we’ll show you how to persist changes made with webkit inspector to plain CSS files, instead of redoing them in your text editor…
I assume you know about Sass or Less and that you love and use at least one of them. Sass and Less are pre-compiled to plain CSS files which are then included in a webpage, in such a way that the browser still “sees” regular CSS. The problem with debugging this compiled CSS is that the source information and line numbers webkit inspector gives you don’t correspond to the actual Sass or Less source files.
Here’s how to make it work.
Prerequisites
First of all you’ll need Chrome 24 which isn’t stable yet, so get on de DEV channel by surfing to
Chrome Release Channels - The Chromium Projects
Home of the Chromium Open Source Projectwww.chromium.org
and clicking on the “Dev Channel” link for your operating system. When Chrome 24 is up and running, open Chrome’s Webkit Inspector (called Developer Tools) by hitting F12 and click on the little Settings gear in the far bottom right.
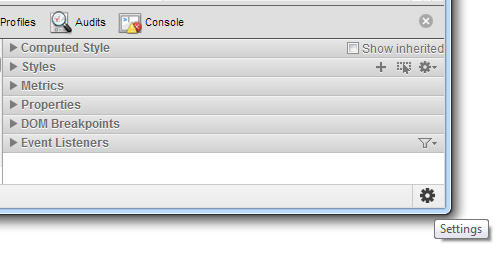
If you’ve never pressed that gear before then you’re in for a sh*load of awesomeness (like faking touch events, user agent identification, device metrics and such for mobile development, etc).
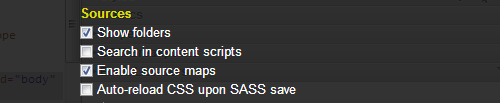
Right now we’ll be opening the first tab labeled “General” and checking “Enable source maps” under the “Sources” section.
Then it’s time for some experimental stuff. Surf to
and choose to “Enable Developer Tools experiments”.
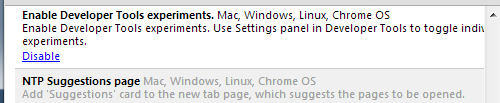
At the bottom of that flags page, a new button called “Relaunch Now” will appear. Hit it.
Now when going into Developer Tools (F12) again and opening the Settings gear from the bottom right, a new tab called Experiments is your friend. Go and enable “Support for SASS”.
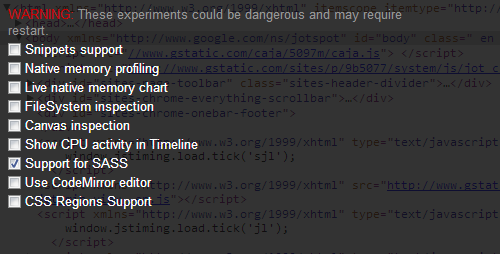
What we have done so far is enabling the Sass “source mapping” in Chrome. Now when we compile Sass to CSS using an optional debug parameter, the generated CSS will have extra information that Chrome can now understand and use to show you the proper line number and filename when debugging.
Okay, time to set up Sass.
Sass installation
First you’ll need Ruby. Windows users should just run the installer from here:
http://rubyinstaller.org/downloads/ (and choose to add Ruby to your PATH).
Then, from the console, type
gem install sass
Now, we’ll assume you want your Sass files in one folder and automatically compile it to CSS in another folder upon each change. We’ll do so by creating a watch. A watch will keep an eye on a file or folder (we’ll stick to folders in this example) and do exactly that what we just described.
Let’s say you’ve got this folder structure for your website:
/
/index.html
/sass/
/sass/style.scss
/css/
And you’ve got this in your style.scss file:
$color: #4D926F;body {
background-color: #333;
h1 {
color: $color;
}
}
Using the console again when in the root folder of that webpage, type
sass –watch –debug-info sass:css
Now keep that watch going as you develop. Each change to your sass file will get compiled to css in the destined css folder. The css files will contain debug information that tells Chrome everything it needs to know. That debug information is written in CSS in the form of sass-vendor-prefixed media queries. Say what? Well, like this:
@media -sass-debug-info{filename{font-family:path/to/style.sass}line{font-family:1}}body {
background-color: #333;
}
It looks a bit weird but what it does is it adds a mediaquery that is doesn’t do anything visually for the actual CSS. But it uses font families to store values as a valid string or number, that are read by Chrome and used in the Developer Tools to give you the information you need.
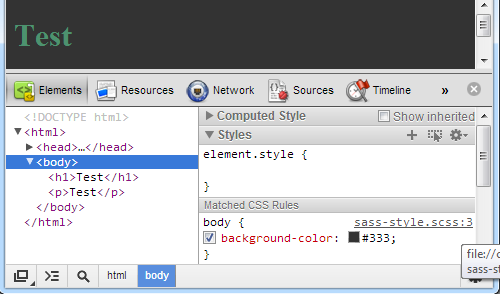
Open up Developer Tools of that page and inspect the body tag. It should now point to the line number and sass filename, like so:
Okay, on to Less then.
Setting up Less
Now that Chrome accepts these sass-prefixed media queries as means to point us to the right file and linenumber, we can (ab)use that and do the exact same for .less files.
So we’ll be needing a watcher that outputs the same information. I couldn’t find a complete solution for this on the web so I built a node package based on existing sources that right now does all we need.
First, install the npm, the node package manager from here:
Index of /download/
Edit descriptionnodejs.org
Now we’ll need to install two packages. The LESS compiler and my LESS watcher. Here goes: from a console, type:
npm install less –global
And
npm install lesswatch –global
The less watcher can be found on github here too in case you want it:
Q42/lesswatch
lesswatch - LESS folder watcher with optional debug informationgithub.com
The less package installed the “lessc” command to your console which compiles .less files to .css. It takes a debug argument “–line-numbers” which outputs the same sass-compatibile mediaquery debug info to the compiled css, but I encountered two problems:
- The formatted media queries probably work with FireSASS but not in Chrome, due to escaping issues
- Existing LESS watchers weren’t able to pass debug params to the lessc command
So my little less watcher passes all debug params to the less command, and it fixes the outputted debug information so Chrome digs it.
Let’s say you’ve got this folder structure:
Let’s say you’ve got this folder structure for your website:
/
/index.html
/less/
/less/style.less
/css/
And you’ve got this in your style.scss file:
@color: #4D926F;body {
background-color: #333;
h1 {
color: @color;
}
}
Using the console again when in the root folder of that webpage, type
lesswatch –line-numbers=mediaquery less css
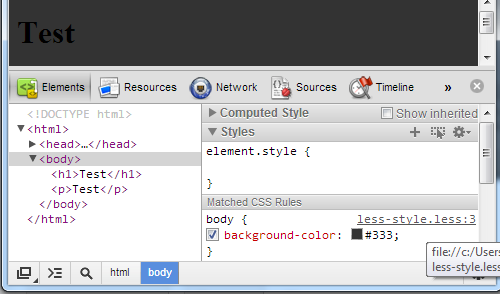
This will watch the less folder for changes and compile its source files to the css destination folder using mediaquery debug information and fixing it once its compiled so Chrome understands. Open up Chrome’s Developer Tools again and inspect the body element. See that the inspector points to the .less file now?
Yay!
Finally, onto saving CSS changes!
Saving CSS changes from within Webkit Inspector
As I said, this doesn’t work directly with .less or .scss files. You have to redo them in your IDE again for now. But if the above debugging approach still hasn’t lured you away from working with vanilla CSS files then you’re in for a treat: Chrome allows for persisting your live modifications right from within the browser! So no more going back to your editor and redoing what you just did.
When inspecting your CSS file and having made changes, click on the filename at the top right of the rule you’ve just edited. In the following screenshot that would be the “style.css” link that points to line number 1:
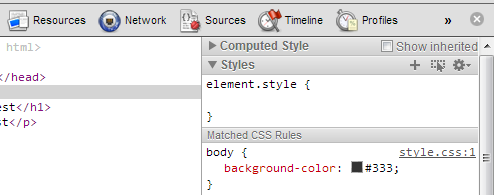
Let’s say I’ve changed that background-color to have a value of #f00. When I click on the filename, it opens in the sources panel. And guess what? The changes I just made have been applied to the file contents that you see. So all we need to do is save the file!
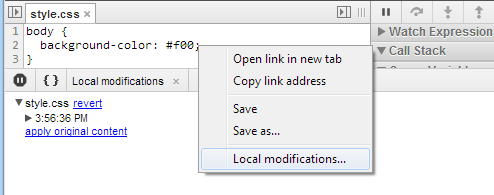
Right click on the file to get the “Save” option:
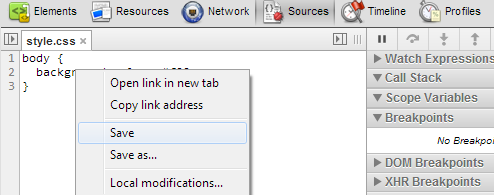
If you haven’t saved this file before, it’ll prompt you to choose where to save that file to. Browse locally to your webapp’s folder and select the original file to overwrite. In this case it’s style.css.
Every subsequent save just needs Ctrl + S to make changes like these persistent!
And if you’ve ever want to revert a change you’ve made, right click again and select “Local modifications”. It’ll give you a history of changes and allow you to revert to any prior version you want.
Knowing that Chrome now also supports mapping sass and less sources to their original files and even being able to open them (and indeed save them) but just not propagate the css changes back to less and sass, I am confident that such a feature will be added to Chrome in the near future, making the lives of us web developers even better.
Although right now, things are already pretty friggin’ awesome, aren’t they?
Happy debugging,
- Martin
Check out our Engineering Blog for more in-depth articles on pragmatic code for happy users!